class: center, middle, inverse, title-slide .title[ # <strong>A Regularized Adjusted Plus-Minus Model in Soccer</strong> ] .subtitle[ ## <strong>with Box Score Prior</strong> ] .author[ ### <strong>Boyuan Zhang (New York University)</strong> ] .institute[ ### <br />Collaborators: Phong Hoang (Denison), Edvin Tran Hoac (Wesleyan) ] .institute[ ### Advisors: Prof. Kostas Pelechrinis (UPitt), Prof. Ron Yurko (CMU) ] .date[ ### <br />Carnegie Mellon Sports Analytics Conference<br />October 29, 2022 ] --- class: inverse center middle # How to evaluate the impact of individual players on their team’s performance within a period of time? --- # Plus-Minus (+/-) Model ## Concept: keeps track of the net changes in the score when a given player is either on or off the court ## Formula: .center[**Plus-Minus for Any Player = (Team Points Scored - Team Points Allowed) While That Player is On The Court**] ## Benefits: - Identify a player’s implied effect on his team’s goal difference while he is on the field - Data required to compute Plus-Minus are already available: only need the player lineups and substitutions records with the times at which they occurred, and goals scored and their corresponding times - Could be employed in any league, on any match, at any time ## Problems: - A player’s effect on his team’s goal differential will change as the makeup of teammates and opponents changes during the game --- # Adjusted Plus-Minus (APM) Model ## Concept: Over a given time period, adjusting the basic plus-minus results to account for both the teammates and the opponents on the court. ## Formula: `$$\frac{T_{total}}{T_{j}} \Delta S = \beta_0 + \beta_1x_1 + \beta_2x_2 + \cdots + \beta_ix_i + \cdots + \beta_nx_n + \epsilon$$` - `\(\Delta S\)`: Score differential, `\(S_{home} - S_{away}\)` - `\(T_j\)`: Length of time segment, the interval in which no substitutions or expulsions occurred, for `\(j = 1, \dots, R\)` segments - `\(\beta_0\)`: Average home team advantage over all teams in the competition - `\(\beta_i\)`: Influence of player `\(i\)` on goal differential, for `\(i = 1, \dots, N\)` players in competition - `\(x_i\)`: Player appearance index: - +1: Player `\(i\)` is playing at home - 0: Player `\(i\)` is not playing - -1: Player `\(i\)` is playing away --- # Adjusted Plus-Minus (APM) Model `$$\beta^* = \arg \min_{\beta} ||\Delta S - tX\beta||_2^2$$` ## Interpretation: APM ratings indicate how many additional points are contributed to a team’s scoring margin by a given player in comparison to the league-average player whose APM value is zero over the span of a typical game. ## Benefits: - Reflects the impact of each player on his team’s scoring margin after controlling for the strength of every teammate and every opponent during each minute he’s on the court ## Problems: - High variance, overfitting, and sensitive to the noise - Multicollinearity: Coaches prefer to use some groups of players more frequently or rarely since all players could not be on the court with every other teammate at the same time --- # Regularized Adjusted Plus-Minus (RAPM) Model ## Concept: Adding regularization into APM model to improve model accuracy. ## Formula: `$$\beta^* = \arg \min_{\beta} ||\Delta S - tX\beta||_2^2 + \lambda||\beta||_2^2$$` ## Benefits: - Significantly reduces standard errors in APM model and provide more accurate prediction results ## Problems: - Multicollinearity: Coaches prefer to use some groups of players more frequently or rarely since all players could not be on the court with every other teammate at the same time --- # Problematic Nature of Soccer <div class="figure" style="text-align: center"> <img src="https://www.intraocular.net/posts/how-augmented-apm-works/scoring_vs_subs_sports-1.png" alt="Matano, et al (2018). Augmenting adjusted plus-minus in soccer with FIFA ratings." width="50%" height="50%" /> <p class="caption">Matano, et al (2018). Augmenting adjusted plus-minus in soccer with FIFA ratings.</p> </div> -- - Low number of substitutions `\(\Longrightarrow\)` multicollinearity between features - Low number of scoring `\(\Longrightarrow\)` sparse response variable --- # Current State of Socceer Player Rating ## Action-based Player Ratings .center[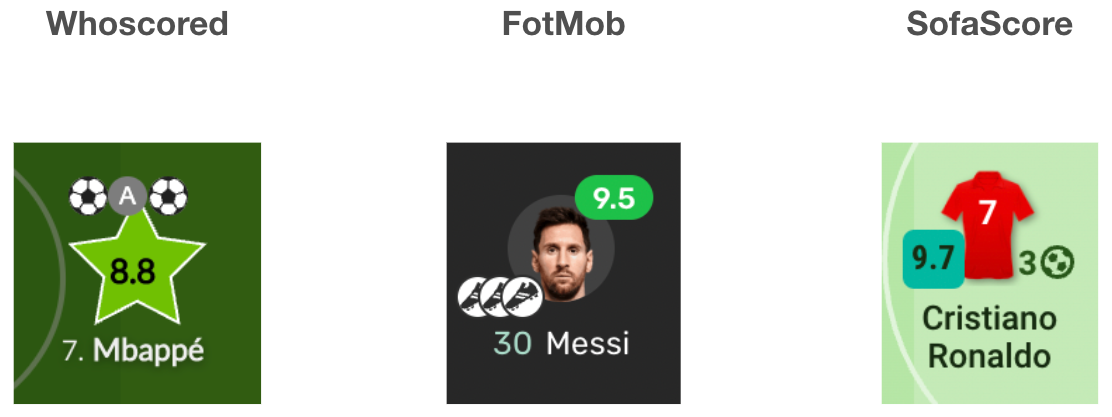] --- # Current State of Socceer Player Rating ## Video Game Player Ratings .center[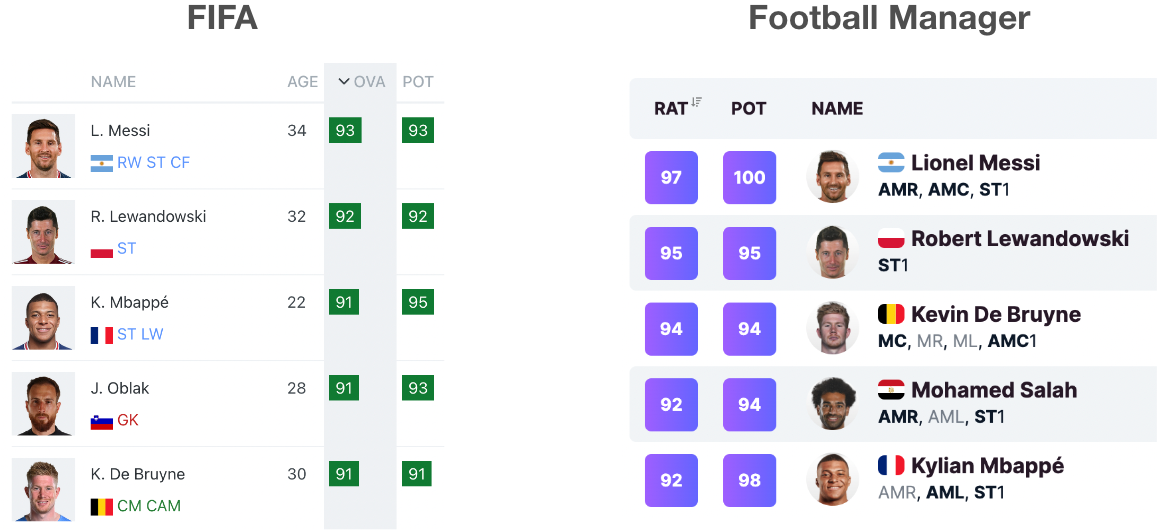] --- # Current State of Socceer Player Rating Matano, F., L. F. Richardson, T. Pospisil, C. Eubanks, and J. Qin (2018): “[`Augmenting Adjusted Plus-Minus in Soccer with FIFA Ratings`](https://arxiv.org/abs/1810.08032),” _Carnegie Mellon Sports Analytics Conference_. - Recasting APM into a Bayesian framework, and incorporating FIFA ratings into the prior distribution - Shown that Argumented APM predicts better than standard APM and a model using only FIFA ratings - Shown that Agumented APM decorrelates players that are highly collinear <img src="image/augumented_apm.png" width="50%" height="50%" style="display: block; margin: auto;" /> --- # RAxGPM with Box Score Prior ## Previous Formula: `$$\beta^* = \arg \min_{\beta} ||\Delta G - tX\beta||_2^2 + \lambda||\beta||_2^2$$` ## New Formula: `$$\beta^* = \arg \min_{\beta} ||\Delta \mathbb{xG} - tX\beta||_2^2 + \lambda||\beta - \beta_{prior}||_2^2$$` - `\(\Delta \mathbb{xG}\)`: Expected Goal differential, `\(\mathbb{xG}_{home} - \mathbb{xG}_{away}\)` - `\(\beta_{prior}\)`: Prior value for each player learned from **box score data** ## Idea: - More frequent response variable - Less collinearity between players --- # Model Pipeline .center[] --- class: inverse center middle # Example: English Premier League 2021-22 Season --- # Data: Prior Stage ## Box Score Data: EPL season 2020-21 and 2021-22 - 3,420 observations and more than 180 features - only consider player with 900 minutes and above in corresponding season - after variable selection, around 30 features are left including the following criteria: - Scoring, creating, dribbling, passing and defensive actions, etc. ## FIFA Ratings 2022 Data: before starts of 2021-22 season - only collected one overall rating for each unique player --- # Data: Prior Stage ## Number of Players by Position Group <img src="presentation_files/figure-html/number_by_position-1.png" width="100%" /> --- # Model Training: Prior ## Feature Importance in Prior Value by Position .center[] --- # Model Training: Prior ## Comparing between FIFA rating and Prior value distribution <img src="presentation_files/figure-html/fifa_rating_prior_distribution-1.png" width="100%" /> --- # Data: RAPM Stage ## Match Summary data: EPL season 2021-22 - collected line-ups, substitutions, and every events for every game - create stint with time start and length: - a stint is created when there is a substitution, a red card, or a goal happens - 4000 stints over 380 matches ## Shooting Data: EPL season 2021-22 - collected shooting information with corresponding expected goals for every shot in the season --- # Data: RAPM Stage ## Match Summary data: EPL season 2021-22 <img src="image/stint_distribution.png" width="60%" height="60%" style="display: block; margin: auto;" /> --- # Data: RAPM Stage .center[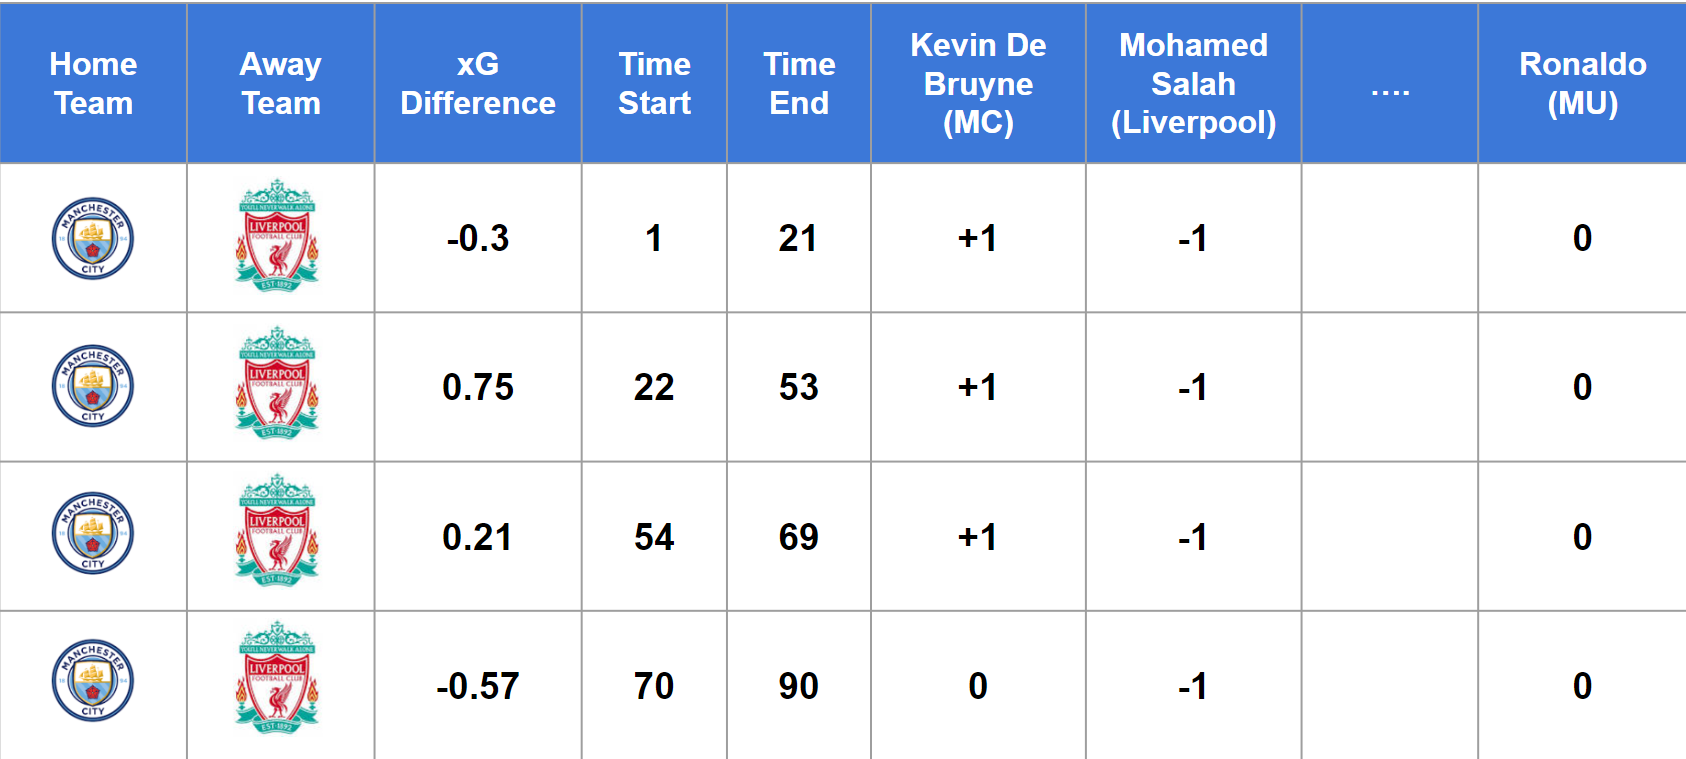] --- # Model Training: RAPM .center[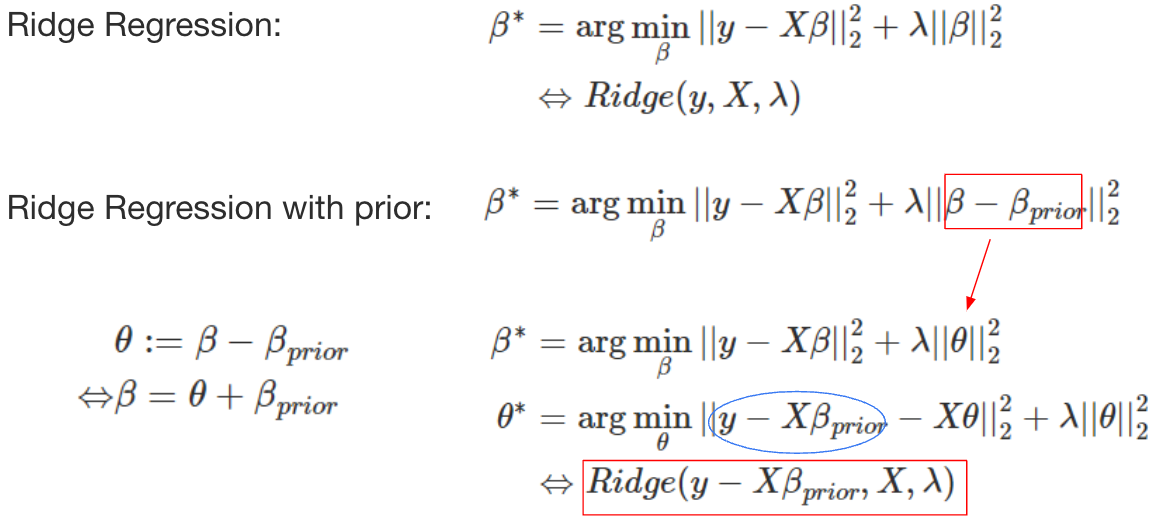] --- # Model Training: RAPM .center[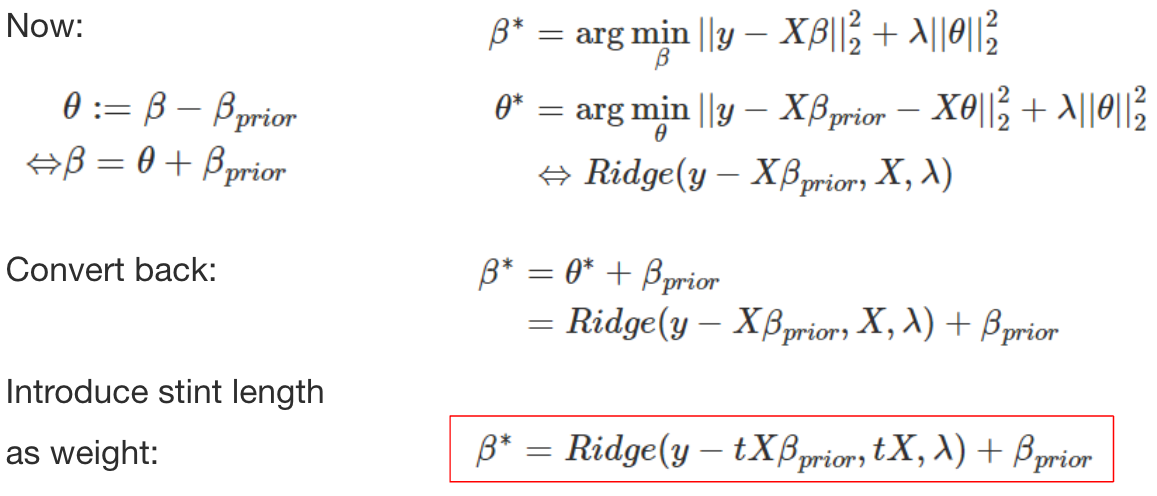] --- # Model Testing: Predictability .center[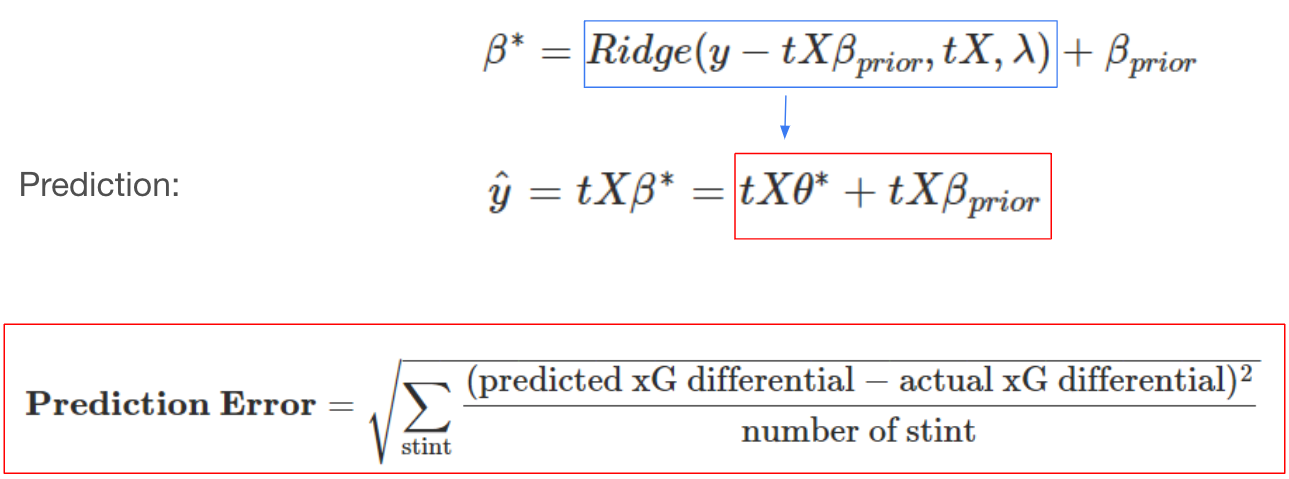] --- # Model Testing: Predictability 10-fold cross-validation with accuracy measured by RMSE: - **RAPM_only**: RAPM model without any prior - **RAPM_FIFA**: RAPM model with FIFA rating directly as prior - **RAPM_box**: RAPM model with prior created from box score data <img src="image/comparison_result.png" width="50%" height="50%" style="display: block; margin: auto;" /> --- # Result: Top 10 Players <div id="jozrgespzo" style="overflow-x:auto;overflow-y:auto;width:auto;height:auto;"> <style>html { font-family: -apple-system, BlinkMacSystemFont, 'Segoe UI', Roboto, Oxygen, Ubuntu, Cantarell, 'Helvetica Neue', 'Fira Sans', 'Droid Sans', Arial, sans-serif; } #jozrgespzo .gt_table { display: table; border-collapse: collapse; margin-left: auto; margin-right: auto; color: #333333; font-size: 16px; font-weight: normal; font-style: normal; background-color: #FFFFFF; width: auto; border-top-style: solid; border-top-width: 2px; border-top-color: #A8A8A8; border-right-style: none; border-right-width: 2px; border-right-color: #D3D3D3; border-bottom-style: solid; border-bottom-width: 2px; border-bottom-color: #A8A8A8; border-left-style: none; border-left-width: 2px; border-left-color: #D3D3D3; } #jozrgespzo .gt_heading { background-color: #FFFFFF; text-align: center; border-bottom-color: #FFFFFF; border-left-style: none; border-left-width: 1px; border-left-color: #D3D3D3; border-right-style: none; border-right-width: 1px; border-right-color: #D3D3D3; } #jozrgespzo .gt_title { color: #333333; font-size: 125%; font-weight: initial; padding-top: 4px; padding-bottom: 4px; padding-left: 5px; padding-right: 5px; border-bottom-color: #FFFFFF; border-bottom-width: 0; } #jozrgespzo .gt_subtitle { color: #333333; font-size: 85%; font-weight: initial; padding-top: 0; padding-bottom: 6px; padding-left: 5px; padding-right: 5px; border-top-color: #FFFFFF; border-top-width: 0; } #jozrgespzo .gt_bottom_border { border-bottom-style: solid; border-bottom-width: 2px; border-bottom-color: #D3D3D3; } #jozrgespzo .gt_col_headings { border-top-style: solid; border-top-width: 2px; border-top-color: #D3D3D3; border-bottom-style: solid; border-bottom-width: 2px; border-bottom-color: #D3D3D3; border-left-style: none; border-left-width: 1px; border-left-color: #D3D3D3; border-right-style: none; border-right-width: 1px; border-right-color: #D3D3D3; } #jozrgespzo .gt_col_heading { color: #333333; background-color: #FFFFFF; font-size: 100%; font-weight: normal; text-transform: inherit; border-left-style: none; border-left-width: 1px; border-left-color: #D3D3D3; border-right-style: none; border-right-width: 1px; border-right-color: #D3D3D3; vertical-align: bottom; padding-top: 5px; padding-bottom: 6px; padding-left: 5px; padding-right: 5px; overflow-x: hidden; } #jozrgespzo .gt_column_spanner_outer { color: #333333; background-color: #FFFFFF; font-size: 100%; font-weight: normal; text-transform: inherit; padding-top: 0; padding-bottom: 0; padding-left: 4px; padding-right: 4px; } #jozrgespzo .gt_column_spanner_outer:first-child { padding-left: 0; } #jozrgespzo .gt_column_spanner_outer:last-child { padding-right: 0; } #jozrgespzo .gt_column_spanner { border-bottom-style: solid; border-bottom-width: 2px; border-bottom-color: #D3D3D3; vertical-align: bottom; padding-top: 5px; padding-bottom: 5px; overflow-x: hidden; display: inline-block; width: 100%; } #jozrgespzo .gt_group_heading { padding-top: 8px; padding-bottom: 8px; padding-left: 5px; padding-right: 5px; color: #333333; background-color: #FFFFFF; font-size: 100%; font-weight: initial; text-transform: inherit; border-top-style: solid; border-top-width: 2px; border-top-color: #D3D3D3; border-bottom-style: solid; border-bottom-width: 2px; border-bottom-color: #D3D3D3; border-left-style: none; border-left-width: 1px; border-left-color: #D3D3D3; border-right-style: none; border-right-width: 1px; border-right-color: #D3D3D3; vertical-align: middle; } #jozrgespzo .gt_empty_group_heading { padding: 0.5px; color: #333333; background-color: #FFFFFF; font-size: 100%; font-weight: initial; border-top-style: solid; border-top-width: 2px; border-top-color: #D3D3D3; border-bottom-style: solid; border-bottom-width: 2px; border-bottom-color: #D3D3D3; vertical-align: middle; } #jozrgespzo .gt_from_md > :first-child { margin-top: 0; } #jozrgespzo .gt_from_md > :last-child { margin-bottom: 0; } #jozrgespzo .gt_row { padding-top: 8px; padding-bottom: 8px; padding-left: 5px; padding-right: 5px; margin: 10px; border-top-style: solid; border-top-width: 1px; border-top-color: #D3D3D3; border-left-style: none; border-left-width: 1px; border-left-color: #D3D3D3; border-right-style: none; border-right-width: 1px; border-right-color: #D3D3D3; vertical-align: middle; overflow-x: hidden; } #jozrgespzo .gt_stub { color: #333333; background-color: #FFFFFF; font-size: 100%; font-weight: initial; text-transform: inherit; border-right-style: solid; border-right-width: 2px; border-right-color: #D3D3D3; padding-left: 5px; padding-right: 5px; } #jozrgespzo .gt_stub_row_group { color: #333333; background-color: #FFFFFF; font-size: 100%; font-weight: initial; text-transform: inherit; border-right-style: solid; border-right-width: 2px; border-right-color: #D3D3D3; padding-left: 5px; padding-right: 5px; vertical-align: top; } #jozrgespzo .gt_row_group_first td { border-top-width: 2px; } #jozrgespzo .gt_summary_row { color: #333333; background-color: #FFFFFF; text-transform: inherit; padding-top: 8px; padding-bottom: 8px; padding-left: 5px; padding-right: 5px; } #jozrgespzo .gt_first_summary_row { border-top-style: solid; border-top-color: #D3D3D3; } #jozrgespzo .gt_first_summary_row.thick { border-top-width: 2px; } #jozrgespzo .gt_last_summary_row { padding-top: 8px; padding-bottom: 8px; padding-left: 5px; padding-right: 5px; border-bottom-style: solid; border-bottom-width: 2px; border-bottom-color: #D3D3D3; } #jozrgespzo .gt_grand_summary_row { color: #333333; background-color: #FFFFFF; text-transform: inherit; padding-top: 8px; padding-bottom: 8px; padding-left: 5px; padding-right: 5px; } #jozrgespzo .gt_first_grand_summary_row { padding-top: 8px; padding-bottom: 8px; padding-left: 5px; padding-right: 5px; border-top-style: double; border-top-width: 6px; border-top-color: #D3D3D3; } #jozrgespzo .gt_striped { background-color: rgba(128, 128, 128, 0.05); } #jozrgespzo .gt_table_body { border-top-style: solid; border-top-width: 2px; border-top-color: #D3D3D3; border-bottom-style: solid; border-bottom-width: 2px; border-bottom-color: #D3D3D3; } #jozrgespzo .gt_footnotes { color: #333333; background-color: #FFFFFF; border-bottom-style: none; border-bottom-width: 2px; border-bottom-color: #D3D3D3; border-left-style: none; border-left-width: 2px; border-left-color: #D3D3D3; border-right-style: none; border-right-width: 2px; border-right-color: #D3D3D3; } #jozrgespzo .gt_footnote { margin: 0px; font-size: 90%; padding-left: 4px; padding-right: 4px; padding-left: 5px; padding-right: 5px; } #jozrgespzo .gt_sourcenotes { color: #333333; background-color: #FFFFFF; border-bottom-style: none; border-bottom-width: 2px; border-bottom-color: #D3D3D3; border-left-style: none; border-left-width: 2px; border-left-color: #D3D3D3; border-right-style: none; border-right-width: 2px; border-right-color: #D3D3D3; } #jozrgespzo .gt_sourcenote { font-size: 90%; padding-top: 4px; padding-bottom: 4px; padding-left: 5px; padding-right: 5px; } #jozrgespzo .gt_left { text-align: left; } #jozrgespzo .gt_center { text-align: center; } #jozrgespzo .gt_right { text-align: right; font-variant-numeric: tabular-nums; } #jozrgespzo .gt_font_normal { font-weight: normal; } #jozrgespzo .gt_font_bold { font-weight: bold; } #jozrgespzo .gt_font_italic { font-style: italic; } #jozrgespzo .gt_super { font-size: 65%; } #jozrgespzo .gt_footnote_marks { font-style: italic; font-weight: normal; font-size: 75%; vertical-align: 0.4em; } #jozrgespzo .gt_asterisk { font-size: 100%; vertical-align: 0; } #jozrgespzo .gt_indent_1 { text-indent: 5px; } #jozrgespzo .gt_indent_2 { text-indent: 10px; } #jozrgespzo .gt_indent_3 { text-indent: 15px; } #jozrgespzo .gt_indent_4 { text-indent: 20px; } #jozrgespzo .gt_indent_5 { text-indent: 25px; } </style> <table class="gt_table"> <thead class="gt_col_headings"> <tr> <th class="gt_col_heading gt_columns_bottom_border gt_left" rowspan="1" colspan="1" scope="col"></th> <th class="gt_col_heading gt_columns_bottom_border gt_left" rowspan="1" colspan="1" scope="col">Player</th> <th class="gt_col_heading gt_columns_bottom_border gt_left" rowspan="1" colspan="1" scope="col">Team</th> <th class="gt_col_heading gt_columns_bottom_border gt_left" rowspan="1" colspan="1" scope="col">Pos</th> <th class="gt_col_heading gt_columns_bottom_border gt_right" rowspan="1" colspan="1" scope="col">Min</th> <th class="gt_col_heading gt_columns_bottom_border gt_right" rowspan="1" colspan="1" scope="col">FIFA</th> <th class="gt_col_heading gt_columns_bottom_border gt_right" rowspan="1" colspan="1" scope="col">FIFA_rating</th> <th class="gt_col_heading gt_columns_bottom_border gt_right" rowspan="1" colspan="1" scope="col">Box</th> <th class="gt_col_heading gt_columns_bottom_border gt_right" rowspan="1" colspan="1" scope="col">box_rating</th> </tr> </thead> <tbody class="gt_table_body"> <tr><th scope="row" class="gt_row gt_right gt_stub">1</th> <td class="gt_row gt_left">Mohamed Salah</td> <td class="gt_row gt_left">Liverpool</td> <td class="gt_row gt_left">FW</td> <td class="gt_row gt_right">2762</td> <td class="gt_row gt_right">89</td> <td class="gt_row gt_right" style="background-color: rgba(171,138,193,0.8); color: #000000;">0.12174911</td> <td class="gt_row gt_right">90.13389</td> <td class="gt_row gt_right" style="background-color: rgba(51,6,98,0.8); color: #FFFFFF;">0.1497441</td></tr> <tr><th scope="row" class="gt_row gt_right gt_stub">2</th> <td class="gt_row gt_left">Reece James</td> <td class="gt_row gt_left">Chelsea</td> <td class="gt_row gt_left">DF</td> <td class="gt_row gt_right">1864</td> <td class="gt_row gt_right">81</td> <td class="gt_row gt_right" style="background-color: rgba(238,230,243,0.8); color: #000000;">0.02262148</td> <td class="gt_row gt_right">87.35088</td> <td class="gt_row gt_right" style="background-color: rgba(216,196,228,0.8); color: #000000;">0.1168662</td></tr> <tr><th scope="row" class="gt_row gt_right gt_stub">3</th> <td class="gt_row gt_left">İlkay Gündoğan</td> <td class="gt_row gt_left">Manchester City</td> <td class="gt_row gt_left">MF</td> <td class="gt_row gt_right">1857</td> <td class="gt_row gt_right">85</td> <td class="gt_row gt_right" style="background-color: rgba(215,195,227,0.8); color: #000000;">0.07182136</td> <td class="gt_row gt_right">87.76583</td> <td class="gt_row gt_right" style="background-color: rgba(217,197,228,0.8); color: #000000;">0.1142307</td></tr> <tr><th scope="row" class="gt_row gt_right gt_stub">4</th> <td class="gt_row gt_left">Sadio Mané</td> <td class="gt_row gt_left">Liverpool</td> <td class="gt_row gt_left">FW</td> <td class="gt_row gt_right">2819</td> <td class="gt_row gt_right">89</td> <td class="gt_row gt_right" style="background-color: rgba(181,149,202,0.8); color: #000000;">0.11953468</td> <td class="gt_row gt_right">87.65664</td> <td class="gt_row gt_right" style="background-color: rgba(221,203,231,0.8); color: #000000;">0.1121862</td></tr> <tr><th scope="row" class="gt_row gt_right gt_stub">5</th> <td class="gt_row gt_left">João Cancelo</td> <td class="gt_row gt_left">Manchester City</td> <td class="gt_row gt_left">DF</td> <td class="gt_row gt_right">3227</td> <td class="gt_row gt_right">86</td> <td class="gt_row gt_right" style="background-color: rgba(215,195,228,0.8); color: #000000;">0.06593877</td> <td class="gt_row gt_right">88.39155</td> <td class="gt_row gt_right" style="background-color: rgba(232,220,239,0.8); color: #000000;">0.1061954</td></tr> <tr><th scope="row" class="gt_row gt_right gt_stub">6</th> <td class="gt_row gt_left">Paul Pogba</td> <td class="gt_row gt_left">Manchester Utd</td> <td class="gt_row gt_left">MF</td> <td class="gt_row gt_right">1349</td> <td class="gt_row gt_right">87</td> <td class="gt_row gt_right" style="background-color: rgba(200,171,217,0.8); color: #000000;">0.11021187</td> <td class="gt_row gt_right">86.09682</td> <td class="gt_row gt_right" style="background-color: rgba(232,221,239,0.8); color: #000000;">0.1060792</td></tr> <tr><th scope="row" class="gt_row gt_right gt_stub">7</th> <td class="gt_row gt_left">Harry Kane</td> <td class="gt_row gt_left">Tottenham</td> <td class="gt_row gt_left">FW</td> <td class="gt_row gt_right">3232</td> <td class="gt_row gt_right">90</td> <td class="gt_row gt_right" style="background-color: rgba(51,6,98,0.8); color: #FFFFFF;">0.14763053</td> <td class="gt_row gt_right">86.78122</td> <td class="gt_row gt_right" style="background-color: rgba(236,227,242,0.8); color: #000000;">0.1040146</td></tr> <tr><th scope="row" class="gt_row gt_right gt_stub">8</th> <td class="gt_row gt_left">Son Heung-min</td> <td class="gt_row gt_left">Tottenham</td> <td class="gt_row gt_left">FW</td> <td class="gt_row gt_right">3006</td> <td class="gt_row gt_right">89</td> <td class="gt_row gt_right" style="background-color: rgba(115,76,148,0.8); color: #FFFFFF;">0.13393589</td> <td class="gt_row gt_right">86.69345</td> <td class="gt_row gt_right" style="background-color: rgba(236,227,242,0.8); color: #000000;">0.1037975</td></tr> <tr><th scope="row" class="gt_row gt_right gt_stub">9</th> <td class="gt_row gt_left">Alisson</td> <td class="gt_row gt_left">Liverpool</td> <td class="gt_row gt_left">GK</td> <td class="gt_row gt_right">3240</td> <td class="gt_row gt_right">89</td> <td class="gt_row gt_right" style="background-color: rgba(198,169,215,0.8); color: #000000;">0.11339948</td> <td class="gt_row gt_right">87.27274</td> <td class="gt_row gt_right" style="background-color: rgba(238,230,243,0.8); color: #000000;">0.1029704</td></tr> <tr><th scope="row" class="gt_row gt_right gt_stub">10</th> <td class="gt_row gt_left">Phil Foden</td> <td class="gt_row gt_left">Manchester City</td> <td class="gt_row gt_left">FW</td> <td class="gt_row gt_right">2128</td> <td class="gt_row gt_right">84</td> <td class="gt_row gt_right" style="background-color: rgba(219,200,230,0.8); color: #000000;">0.05020127</td> <td class="gt_row gt_right">87.30791</td> <td class="gt_row gt_right" style="background-color: rgba(238,230,243,0.8); color: #000000;">0.1029035</td></tr> </tbody> </table> </div> --- # Result: Top 10-20 Players <div id="nkvnfhqxfk" style="overflow-x:auto;overflow-y:auto;width:auto;height:auto;"> <style>html { font-family: -apple-system, BlinkMacSystemFont, 'Segoe UI', Roboto, Oxygen, Ubuntu, Cantarell, 'Helvetica Neue', 'Fira Sans', 'Droid Sans', Arial, sans-serif; } #nkvnfhqxfk .gt_table { display: table; border-collapse: collapse; margin-left: auto; margin-right: auto; color: #333333; font-size: 16px; font-weight: normal; font-style: normal; background-color: #FFFFFF; width: auto; border-top-style: solid; border-top-width: 2px; border-top-color: #A8A8A8; border-right-style: none; border-right-width: 2px; border-right-color: #D3D3D3; border-bottom-style: solid; border-bottom-width: 2px; border-bottom-color: #A8A8A8; border-left-style: none; border-left-width: 2px; border-left-color: #D3D3D3; } #nkvnfhqxfk .gt_heading { background-color: #FFFFFF; text-align: center; border-bottom-color: #FFFFFF; border-left-style: none; border-left-width: 1px; border-left-color: #D3D3D3; border-right-style: none; border-right-width: 1px; border-right-color: #D3D3D3; } #nkvnfhqxfk .gt_title { color: #333333; font-size: 125%; font-weight: initial; padding-top: 4px; padding-bottom: 4px; padding-left: 5px; padding-right: 5px; border-bottom-color: #FFFFFF; border-bottom-width: 0; } #nkvnfhqxfk .gt_subtitle { color: #333333; font-size: 85%; font-weight: initial; padding-top: 0; padding-bottom: 6px; padding-left: 5px; padding-right: 5px; border-top-color: #FFFFFF; border-top-width: 0; } #nkvnfhqxfk .gt_bottom_border { border-bottom-style: solid; border-bottom-width: 2px; border-bottom-color: #D3D3D3; } #nkvnfhqxfk .gt_col_headings { border-top-style: solid; border-top-width: 2px; border-top-color: #D3D3D3; border-bottom-style: solid; border-bottom-width: 2px; border-bottom-color: #D3D3D3; border-left-style: none; border-left-width: 1px; border-left-color: #D3D3D3; border-right-style: none; border-right-width: 1px; border-right-color: #D3D3D3; } #nkvnfhqxfk .gt_col_heading { color: #333333; background-color: #FFFFFF; font-size: 100%; font-weight: normal; text-transform: inherit; border-left-style: none; border-left-width: 1px; border-left-color: #D3D3D3; border-right-style: none; border-right-width: 1px; border-right-color: #D3D3D3; vertical-align: bottom; padding-top: 5px; padding-bottom: 6px; padding-left: 5px; padding-right: 5px; overflow-x: hidden; } #nkvnfhqxfk .gt_column_spanner_outer { color: #333333; background-color: #FFFFFF; font-size: 100%; font-weight: normal; text-transform: inherit; padding-top: 0; padding-bottom: 0; padding-left: 4px; padding-right: 4px; } #nkvnfhqxfk .gt_column_spanner_outer:first-child { padding-left: 0; } #nkvnfhqxfk .gt_column_spanner_outer:last-child { padding-right: 0; } #nkvnfhqxfk .gt_column_spanner { border-bottom-style: solid; border-bottom-width: 2px; border-bottom-color: #D3D3D3; vertical-align: bottom; padding-top: 5px; padding-bottom: 5px; overflow-x: hidden; display: inline-block; width: 100%; } #nkvnfhqxfk .gt_group_heading { padding-top: 8px; padding-bottom: 8px; padding-left: 5px; padding-right: 5px; color: #333333; background-color: #FFFFFF; font-size: 100%; font-weight: initial; text-transform: inherit; border-top-style: solid; border-top-width: 2px; border-top-color: #D3D3D3; border-bottom-style: solid; border-bottom-width: 2px; border-bottom-color: #D3D3D3; border-left-style: none; border-left-width: 1px; border-left-color: #D3D3D3; border-right-style: none; border-right-width: 1px; border-right-color: #D3D3D3; vertical-align: middle; } #nkvnfhqxfk .gt_empty_group_heading { padding: 0.5px; color: #333333; background-color: #FFFFFF; font-size: 100%; font-weight: initial; border-top-style: solid; border-top-width: 2px; border-top-color: #D3D3D3; border-bottom-style: solid; border-bottom-width: 2px; border-bottom-color: #D3D3D3; vertical-align: middle; } #nkvnfhqxfk .gt_from_md > :first-child { margin-top: 0; } #nkvnfhqxfk .gt_from_md > :last-child { margin-bottom: 0; } #nkvnfhqxfk .gt_row { padding-top: 8px; padding-bottom: 8px; padding-left: 5px; padding-right: 5px; margin: 10px; border-top-style: solid; border-top-width: 1px; border-top-color: #D3D3D3; border-left-style: none; border-left-width: 1px; border-left-color: #D3D3D3; border-right-style: none; border-right-width: 1px; border-right-color: #D3D3D3; vertical-align: middle; overflow-x: hidden; } #nkvnfhqxfk .gt_stub { color: #333333; background-color: #FFFFFF; font-size: 100%; font-weight: initial; text-transform: inherit; border-right-style: solid; border-right-width: 2px; border-right-color: #D3D3D3; padding-left: 5px; padding-right: 5px; } #nkvnfhqxfk .gt_stub_row_group { color: #333333; background-color: #FFFFFF; font-size: 100%; font-weight: initial; text-transform: inherit; border-right-style: solid; border-right-width: 2px; border-right-color: #D3D3D3; padding-left: 5px; padding-right: 5px; vertical-align: top; } #nkvnfhqxfk .gt_row_group_first td { border-top-width: 2px; } #nkvnfhqxfk .gt_summary_row { color: #333333; background-color: #FFFFFF; text-transform: inherit; padding-top: 8px; padding-bottom: 8px; padding-left: 5px; padding-right: 5px; } #nkvnfhqxfk .gt_first_summary_row { border-top-style: solid; border-top-color: #D3D3D3; } #nkvnfhqxfk .gt_first_summary_row.thick { border-top-width: 2px; } #nkvnfhqxfk .gt_last_summary_row { padding-top: 8px; padding-bottom: 8px; padding-left: 5px; padding-right: 5px; border-bottom-style: solid; border-bottom-width: 2px; border-bottom-color: #D3D3D3; } #nkvnfhqxfk .gt_grand_summary_row { color: #333333; background-color: #FFFFFF; text-transform: inherit; padding-top: 8px; padding-bottom: 8px; padding-left: 5px; padding-right: 5px; } #nkvnfhqxfk .gt_first_grand_summary_row { padding-top: 8px; padding-bottom: 8px; padding-left: 5px; padding-right: 5px; border-top-style: double; border-top-width: 6px; border-top-color: #D3D3D3; } #nkvnfhqxfk .gt_striped { background-color: rgba(128, 128, 128, 0.05); } #nkvnfhqxfk .gt_table_body { border-top-style: solid; border-top-width: 2px; border-top-color: #D3D3D3; border-bottom-style: solid; border-bottom-width: 2px; border-bottom-color: #D3D3D3; } #nkvnfhqxfk .gt_footnotes { color: #333333; background-color: #FFFFFF; border-bottom-style: none; border-bottom-width: 2px; border-bottom-color: #D3D3D3; border-left-style: none; border-left-width: 2px; border-left-color: #D3D3D3; border-right-style: none; border-right-width: 2px; border-right-color: #D3D3D3; } #nkvnfhqxfk .gt_footnote { margin: 0px; font-size: 90%; padding-left: 4px; padding-right: 4px; padding-left: 5px; padding-right: 5px; } #nkvnfhqxfk .gt_sourcenotes { color: #333333; background-color: #FFFFFF; border-bottom-style: none; border-bottom-width: 2px; border-bottom-color: #D3D3D3; border-left-style: none; border-left-width: 2px; border-left-color: #D3D3D3; border-right-style: none; border-right-width: 2px; border-right-color: #D3D3D3; } #nkvnfhqxfk .gt_sourcenote { font-size: 90%; padding-top: 4px; padding-bottom: 4px; padding-left: 5px; padding-right: 5px; } #nkvnfhqxfk .gt_left { text-align: left; } #nkvnfhqxfk .gt_center { text-align: center; } #nkvnfhqxfk .gt_right { text-align: right; font-variant-numeric: tabular-nums; } #nkvnfhqxfk .gt_font_normal { font-weight: normal; } #nkvnfhqxfk .gt_font_bold { font-weight: bold; } #nkvnfhqxfk .gt_font_italic { font-style: italic; } #nkvnfhqxfk .gt_super { font-size: 65%; } #nkvnfhqxfk .gt_footnote_marks { font-style: italic; font-weight: normal; font-size: 75%; vertical-align: 0.4em; } #nkvnfhqxfk .gt_asterisk { font-size: 100%; vertical-align: 0; } #nkvnfhqxfk .gt_indent_1 { text-indent: 5px; } #nkvnfhqxfk .gt_indent_2 { text-indent: 10px; } #nkvnfhqxfk .gt_indent_3 { text-indent: 15px; } #nkvnfhqxfk .gt_indent_4 { text-indent: 20px; } #nkvnfhqxfk .gt_indent_5 { text-indent: 25px; } </style> <table class="gt_table"> <thead class="gt_col_headings"> <tr> <th class="gt_col_heading gt_columns_bottom_border gt_left" rowspan="1" colspan="1" scope="col"></th> <th class="gt_col_heading gt_columns_bottom_border gt_left" rowspan="1" colspan="1" scope="col">Player</th> <th class="gt_col_heading gt_columns_bottom_border gt_left" rowspan="1" colspan="1" scope="col">Team</th> <th class="gt_col_heading gt_columns_bottom_border gt_left" rowspan="1" colspan="1" scope="col">Pos</th> <th class="gt_col_heading gt_columns_bottom_border gt_right" rowspan="1" colspan="1" scope="col">Min</th> <th class="gt_col_heading gt_columns_bottom_border gt_right" rowspan="1" colspan="1" scope="col">FIFA</th> <th class="gt_col_heading gt_columns_bottom_border gt_right" rowspan="1" colspan="1" scope="col">FIFA_rating</th> <th class="gt_col_heading gt_columns_bottom_border gt_right" rowspan="1" colspan="1" scope="col">Box</th> <th class="gt_col_heading gt_columns_bottom_border gt_right" rowspan="1" colspan="1" scope="col">box_rating</th> </tr> </thead> <tbody class="gt_table_body"> <tr><th scope="row" class="gt_row gt_right gt_stub">1</th> <td class="gt_row gt_left">Ederson</td> <td class="gt_row gt_left">Manchester City</td> <td class="gt_row gt_left">GK</td> <td class="gt_row gt_right">3330</td> <td class="gt_row gt_right">89</td> <td class="gt_row gt_right" style="background-color: rgba(114,53,159,0.8); color: #FFFFFF;">0.10897867</td> <td class="gt_row gt_right">88.14836</td> <td class="gt_row gt_right" style="background-color: rgba(51,6,98,0.8); color: #FFFFFF;">0.10238281</td></tr> <tr><th scope="row" class="gt_row gt_right gt_stub">2</th> <td class="gt_row gt_left">Rúben Dias</td> <td class="gt_row gt_left">Manchester City</td> <td class="gt_row gt_left">DF</td> <td class="gt_row gt_right">2402</td> <td class="gt_row gt_right">87</td> <td class="gt_row gt_right" style="background-color: rgba(115,59,160,0.8); color: #FFFFFF;">0.09109630</td> <td class="gt_row gt_right">87.23700</td> <td class="gt_row gt_right" style="background-color: rgba(110,46,155,0.8); color: #FFFFFF;">0.09924433</td></tr> <tr><th scope="row" class="gt_row gt_right gt_stub">3</th> <td class="gt_row gt_left">Rodri</td> <td class="gt_row gt_left">Manchester City</td> <td class="gt_row gt_left">MF</td> <td class="gt_row gt_right">2884</td> <td class="gt_row gt_right">86</td> <td class="gt_row gt_right" style="background-color: rgba(143,96,178,0.8); color: #FFFFFF;">0.07158721</td> <td class="gt_row gt_right">87.50666</td> <td class="gt_row gt_right" style="background-color: rgba(114,54,159,0.8); color: #FFFFFF;">0.09765550</td></tr> <tr><th scope="row" class="gt_row gt_right gt_stub">4</th> <td class="gt_row gt_left">Roberto Firmino</td> <td class="gt_row gt_left">Liverpool</td> <td class="gt_row gt_left">FW</td> <td class="gt_row gt_right">990</td> <td class="gt_row gt_right">85</td> <td class="gt_row gt_right" style="background-color: rgba(116,62,160,0.8); color: #FFFFFF;">0.08445760</td> <td class="gt_row gt_right">85.44965</td> <td class="gt_row gt_right" style="background-color: rgba(131,81,170,0.8); color: #FFFFFF;">0.09521369</td></tr> <tr><th scope="row" class="gt_row gt_right gt_stub">5</th> <td class="gt_row gt_left">Gabriel Jesus</td> <td class="gt_row gt_left">Manchester City</td> <td class="gt_row gt_left">FW</td> <td class="gt_row gt_right">1877</td> <td class="gt_row gt_right">83</td> <td class="gt_row gt_right" style="background-color: rgba(197,167,215,0.8); color: #000000;">0.04402586</td> <td class="gt_row gt_right">86.32616</td> <td class="gt_row gt_right" style="background-color: rgba(153,109,185,0.8); color: #000000;">0.09429259</td></tr> <tr><th scope="row" class="gt_row gt_right gt_stub">6</th> <td class="gt_row gt_left">Raheem Sterling</td> <td class="gt_row gt_left">Manchester City</td> <td class="gt_row gt_left">FW</td> <td class="gt_row gt_right">2128</td> <td class="gt_row gt_right">88</td> <td class="gt_row gt_right" style="background-color: rgba(114,52,159,0.8); color: #FFFFFF;">0.11026872</td> <td class="gt_row gt_right">86.64789</td> <td class="gt_row gt_right" style="background-color: rgba(162,120,191,0.8); color: #000000;">0.09390230</td></tr> <tr><th scope="row" class="gt_row gt_right gt_stub">7</th> <td class="gt_row gt_left">Luis Díaz</td> <td class="gt_row gt_left">Liverpool</td> <td class="gt_row gt_left">FW</td> <td class="gt_row gt_right">958</td> <td class="gt_row gt_right">80</td> <td class="gt_row gt_right" style="background-color: rgba(238,230,243,0.8); color: #000000;">0.01084548</td> <td class="gt_row gt_right">85.32550</td> <td class="gt_row gt_right" style="background-color: rgba(188,155,209,0.8); color: #000000;">0.09277333</td></tr> <tr><th scope="row" class="gt_row gt_right gt_stub">8</th> <td class="gt_row gt_left">Kevin De Bruyne</td> <td class="gt_row gt_left">Manchester City</td> <td class="gt_row gt_left">MF</td> <td class="gt_row gt_right">2201</td> <td class="gt_row gt_right">91</td> <td class="gt_row gt_right" style="background-color: rgba(60,12,106,0.8); color: #FFFFFF;">0.15216341</td> <td class="gt_row gt_right">86.60226</td> <td class="gt_row gt_right" style="background-color: rgba(194,163,213,0.8); color: #000000;">0.09247912</td></tr> <tr><th scope="row" class="gt_row gt_right gt_stub">9</th> <td class="gt_row gt_left">Cristiano Ronaldo</td> <td class="gt_row gt_left">Manchester Utd</td> <td class="gt_row gt_left">FW</td> <td class="gt_row gt_right">2456</td> <td class="gt_row gt_right">91</td> <td class="gt_row gt_right" style="background-color: rgba(51,6,98,0.8); color: #FFFFFF;">0.15745070</td> <td class="gt_row gt_right">85.19735</td> <td class="gt_row gt_right" style="background-color: rgba(212,189,225,0.8); color: #000000;">0.09123895</td></tr> <tr><th scope="row" class="gt_row gt_right gt_stub">10</th> <td class="gt_row gt_left">Aymeric Laporte</td> <td class="gt_row gt_left">Manchester City</td> <td class="gt_row gt_left">DF</td> <td class="gt_row gt_right">2828</td> <td class="gt_row gt_right">86</td> <td class="gt_row gt_right" style="background-color: rgba(146,99,180,0.8); color: #FFFFFF;">0.07031695</td> <td class="gt_row gt_right">86.94222</td> <td class="gt_row gt_right" style="background-color: rgba(238,230,243,0.8); color: #000000;">0.08930280</td></tr> </tbody> </table> </div> --- # Result: Bottom 10 Players <div id="bxelbytvcn" style="overflow-x:auto;overflow-y:auto;width:auto;height:auto;"> <style>html { font-family: -apple-system, BlinkMacSystemFont, 'Segoe UI', Roboto, Oxygen, Ubuntu, Cantarell, 'Helvetica Neue', 'Fira Sans', 'Droid Sans', Arial, sans-serif; } #bxelbytvcn .gt_table { display: table; border-collapse: collapse; margin-left: auto; margin-right: auto; color: #333333; font-size: 16px; font-weight: normal; font-style: normal; background-color: #FFFFFF; width: auto; border-top-style: solid; border-top-width: 2px; border-top-color: #A8A8A8; border-right-style: none; border-right-width: 2px; border-right-color: #D3D3D3; border-bottom-style: solid; border-bottom-width: 2px; border-bottom-color: #A8A8A8; border-left-style: none; border-left-width: 2px; border-left-color: #D3D3D3; } #bxelbytvcn .gt_heading { background-color: #FFFFFF; text-align: center; border-bottom-color: #FFFFFF; border-left-style: none; border-left-width: 1px; border-left-color: #D3D3D3; border-right-style: none; border-right-width: 1px; border-right-color: #D3D3D3; } #bxelbytvcn .gt_title { color: #333333; font-size: 125%; font-weight: initial; padding-top: 4px; padding-bottom: 4px; padding-left: 5px; padding-right: 5px; border-bottom-color: #FFFFFF; border-bottom-width: 0; } #bxelbytvcn .gt_subtitle { color: #333333; font-size: 85%; font-weight: initial; padding-top: 0; padding-bottom: 6px; padding-left: 5px; padding-right: 5px; border-top-color: #FFFFFF; border-top-width: 0; } #bxelbytvcn .gt_bottom_border { border-bottom-style: solid; border-bottom-width: 2px; border-bottom-color: #D3D3D3; } #bxelbytvcn .gt_col_headings { border-top-style: solid; border-top-width: 2px; border-top-color: #D3D3D3; border-bottom-style: solid; border-bottom-width: 2px; border-bottom-color: #D3D3D3; border-left-style: none; border-left-width: 1px; border-left-color: #D3D3D3; border-right-style: none; border-right-width: 1px; border-right-color: #D3D3D3; } #bxelbytvcn .gt_col_heading { color: #333333; background-color: #FFFFFF; font-size: 100%; font-weight: normal; text-transform: inherit; border-left-style: none; border-left-width: 1px; border-left-color: #D3D3D3; border-right-style: none; border-right-width: 1px; border-right-color: #D3D3D3; vertical-align: bottom; padding-top: 5px; padding-bottom: 6px; padding-left: 5px; padding-right: 5px; overflow-x: hidden; } #bxelbytvcn .gt_column_spanner_outer { color: #333333; background-color: #FFFFFF; font-size: 100%; font-weight: normal; text-transform: inherit; padding-top: 0; padding-bottom: 0; padding-left: 4px; padding-right: 4px; } #bxelbytvcn .gt_column_spanner_outer:first-child { padding-left: 0; } #bxelbytvcn .gt_column_spanner_outer:last-child { padding-right: 0; } #bxelbytvcn .gt_column_spanner { border-bottom-style: solid; border-bottom-width: 2px; border-bottom-color: #D3D3D3; vertical-align: bottom; padding-top: 5px; padding-bottom: 5px; overflow-x: hidden; display: inline-block; width: 100%; } #bxelbytvcn .gt_group_heading { padding-top: 8px; padding-bottom: 8px; padding-left: 5px; padding-right: 5px; color: #333333; background-color: #FFFFFF; font-size: 100%; font-weight: initial; text-transform: inherit; border-top-style: solid; border-top-width: 2px; border-top-color: #D3D3D3; border-bottom-style: solid; border-bottom-width: 2px; border-bottom-color: #D3D3D3; border-left-style: none; border-left-width: 1px; border-left-color: #D3D3D3; border-right-style: none; border-right-width: 1px; border-right-color: #D3D3D3; vertical-align: middle; } #bxelbytvcn .gt_empty_group_heading { padding: 0.5px; color: #333333; background-color: #FFFFFF; font-size: 100%; font-weight: initial; border-top-style: solid; border-top-width: 2px; border-top-color: #D3D3D3; border-bottom-style: solid; border-bottom-width: 2px; border-bottom-color: #D3D3D3; vertical-align: middle; } #bxelbytvcn .gt_from_md > :first-child { margin-top: 0; } #bxelbytvcn .gt_from_md > :last-child { margin-bottom: 0; } #bxelbytvcn .gt_row { padding-top: 8px; padding-bottom: 8px; padding-left: 5px; padding-right: 5px; margin: 10px; border-top-style: solid; border-top-width: 1px; border-top-color: #D3D3D3; border-left-style: none; border-left-width: 1px; border-left-color: #D3D3D3; border-right-style: none; border-right-width: 1px; border-right-color: #D3D3D3; vertical-align: middle; overflow-x: hidden; } #bxelbytvcn .gt_stub { color: #333333; background-color: #FFFFFF; font-size: 100%; font-weight: initial; text-transform: inherit; border-right-style: solid; border-right-width: 2px; border-right-color: #D3D3D3; padding-left: 5px; padding-right: 5px; } #bxelbytvcn .gt_stub_row_group { color: #333333; background-color: #FFFFFF; font-size: 100%; font-weight: initial; text-transform: inherit; border-right-style: solid; border-right-width: 2px; border-right-color: #D3D3D3; padding-left: 5px; padding-right: 5px; vertical-align: top; } #bxelbytvcn .gt_row_group_first td { border-top-width: 2px; } #bxelbytvcn .gt_summary_row { color: #333333; background-color: #FFFFFF; text-transform: inherit; padding-top: 8px; padding-bottom: 8px; padding-left: 5px; padding-right: 5px; } #bxelbytvcn .gt_first_summary_row { border-top-style: solid; border-top-color: #D3D3D3; } #bxelbytvcn .gt_first_summary_row.thick { border-top-width: 2px; } #bxelbytvcn .gt_last_summary_row { padding-top: 8px; padding-bottom: 8px; padding-left: 5px; padding-right: 5px; border-bottom-style: solid; border-bottom-width: 2px; border-bottom-color: #D3D3D3; } #bxelbytvcn .gt_grand_summary_row { color: #333333; background-color: #FFFFFF; text-transform: inherit; padding-top: 8px; padding-bottom: 8px; padding-left: 5px; padding-right: 5px; } #bxelbytvcn .gt_first_grand_summary_row { padding-top: 8px; padding-bottom: 8px; padding-left: 5px; padding-right: 5px; border-top-style: double; border-top-width: 6px; border-top-color: #D3D3D3; } #bxelbytvcn .gt_striped { background-color: rgba(128, 128, 128, 0.05); } #bxelbytvcn .gt_table_body { border-top-style: solid; border-top-width: 2px; border-top-color: #D3D3D3; border-bottom-style: solid; border-bottom-width: 2px; border-bottom-color: #D3D3D3; } #bxelbytvcn .gt_footnotes { color: #333333; background-color: #FFFFFF; border-bottom-style: none; border-bottom-width: 2px; border-bottom-color: #D3D3D3; border-left-style: none; border-left-width: 2px; border-left-color: #D3D3D3; border-right-style: none; border-right-width: 2px; border-right-color: #D3D3D3; } #bxelbytvcn .gt_footnote { margin: 0px; font-size: 90%; padding-left: 4px; padding-right: 4px; padding-left: 5px; padding-right: 5px; } #bxelbytvcn .gt_sourcenotes { color: #333333; background-color: #FFFFFF; border-bottom-style: none; border-bottom-width: 2px; border-bottom-color: #D3D3D3; border-left-style: none; border-left-width: 2px; border-left-color: #D3D3D3; border-right-style: none; border-right-width: 2px; border-right-color: #D3D3D3; } #bxelbytvcn .gt_sourcenote { font-size: 90%; padding-top: 4px; padding-bottom: 4px; padding-left: 5px; padding-right: 5px; } #bxelbytvcn .gt_left { text-align: left; } #bxelbytvcn .gt_center { text-align: center; } #bxelbytvcn .gt_right { text-align: right; font-variant-numeric: tabular-nums; } #bxelbytvcn .gt_font_normal { font-weight: normal; } #bxelbytvcn .gt_font_bold { font-weight: bold; } #bxelbytvcn .gt_font_italic { font-style: italic; } #bxelbytvcn .gt_super { font-size: 65%; } #bxelbytvcn .gt_footnote_marks { font-style: italic; font-weight: normal; font-size: 75%; vertical-align: 0.4em; } #bxelbytvcn .gt_asterisk { font-size: 100%; vertical-align: 0; } #bxelbytvcn .gt_indent_1 { text-indent: 5px; } #bxelbytvcn .gt_indent_2 { text-indent: 10px; } #bxelbytvcn .gt_indent_3 { text-indent: 15px; } #bxelbytvcn .gt_indent_4 { text-indent: 20px; } #bxelbytvcn .gt_indent_5 { text-indent: 25px; } </style> <table class="gt_table"> <thead class="gt_col_headings"> <tr> <th class="gt_col_heading gt_columns_bottom_border gt_left" rowspan="1" colspan="1" scope="col"></th> <th class="gt_col_heading gt_columns_bottom_border gt_left" rowspan="1" colspan="1" scope="col">Player</th> <th class="gt_col_heading gt_columns_bottom_border gt_left" rowspan="1" colspan="1" scope="col">Team</th> <th class="gt_col_heading gt_columns_bottom_border gt_left" rowspan="1" colspan="1" scope="col">Pos</th> <th class="gt_col_heading gt_columns_bottom_border gt_right" rowspan="1" colspan="1" scope="col">Min</th> <th class="gt_col_heading gt_columns_bottom_border gt_right" rowspan="1" colspan="1" scope="col">FIFA</th> <th class="gt_col_heading gt_columns_bottom_border gt_right" rowspan="1" colspan="1" scope="col">FIFA_rating</th> <th class="gt_col_heading gt_columns_bottom_border gt_right" rowspan="1" colspan="1" scope="col">Box</th> <th class="gt_col_heading gt_columns_bottom_border gt_right" rowspan="1" colspan="1" scope="col">box_rating</th> </tr> </thead> <tbody class="gt_table_body"> <tr><th scope="row" class="gt_row gt_right gt_stub">1</th> <td class="gt_row gt_left">Jeremy Ngakia</td> <td class="gt_row gt_left">Watford</td> <td class="gt_row gt_left">DF</td> <td class="gt_row gt_right">903</td> <td class="gt_row gt_right">69</td> <td class="gt_row gt_right" style="background-color: rgba(230,218,238,0.8); color: #000000;">-0.13144729</td> <td class="gt_row gt_right">69.64005</td> <td class="gt_row gt_right" style="background-color: rgba(238,230,243,0.8); color: #000000;">-0.12464625</td></tr> <tr><th scope="row" class="gt_row gt_right gt_stub">2</th> <td class="gt_row gt_left">Shandon Baptiste</td> <td class="gt_row gt_left">Brentford</td> <td class="gt_row gt_left">MF</td> <td class="gt_row gt_right">910</td> <td class="gt_row gt_right">66</td> <td class="gt_row gt_right" style="background-color: rgba(238,230,243,0.8); color: #000000;">-0.17288570</td> <td class="gt_row gt_right">70.38732</td> <td class="gt_row gt_right" style="background-color: rgba(229,216,237,0.8); color: #000000;">-0.11385921</td></tr> <tr><th scope="row" class="gt_row gt_right gt_stub">3</th> <td class="gt_row gt_left">Chris Wood</td> <td class="gt_row gt_left">Burnley</td> <td class="gt_row gt_left">FW</td> <td class="gt_row gt_right">2694</td> <td class="gt_row gt_right">79</td> <td class="gt_row gt_right" style="background-color: rgba(51,6,98,0.8); color: #FFFFFF;">0.01453329</td> <td class="gt_row gt_right">70.97824</td> <td class="gt_row gt_right" style="background-color: rgba(185,149,206,0.8); color: #000000;">-0.09518406</td></tr> <tr><th scope="row" class="gt_row gt_right gt_stub">4</th> <td class="gt_row gt_left">Chris Wood</td> <td class="gt_row gt_left">Newcastle Utd</td> <td class="gt_row gt_left">FW</td> <td class="gt_row gt_right">2694</td> <td class="gt_row gt_right">79</td> <td class="gt_row gt_right" style="background-color: rgba(51,6,98,0.8); color: #FFFFFF;">0.01453329</td> <td class="gt_row gt_right">70.97824</td> <td class="gt_row gt_right" style="background-color: rgba(185,149,206,0.8); color: #000000;">-0.09518406</td></tr> <tr><th scope="row" class="gt_row gt_right gt_stub">5</th> <td class="gt_row gt_left">Aaron Lennon</td> <td class="gt_row gt_left">Burnley</td> <td class="gt_row gt_left">MF</td> <td class="gt_row gt_right">1551</td> <td class="gt_row gt_right">73</td> <td class="gt_row gt_right" style="background-color: rgba(198,169,215,0.8); color: #000000;">-0.07654352</td> <td class="gt_row gt_right">71.67621</td> <td class="gt_row gt_right" style="background-color: rgba(152,112,179,0.8); color: #000000;">-0.09010116</td></tr> <tr><th scope="row" class="gt_row gt_right gt_stub">6</th> <td class="gt_row gt_left">Ashley Young</td> <td class="gt_row gt_left">Aston Villa</td> <td class="gt_row gt_left">DF</td> <td class="gt_row gt_right">1250</td> <td class="gt_row gt_right">78</td> <td class="gt_row gt_right" style="background-color: rgba(109,67,144,0.8); color: #FFFFFF;">-0.00644885</td> <td class="gt_row gt_right">72.19038</td> <td class="gt_row gt_right" style="background-color: rgba(147,106,175,0.8); color: #000000;">-0.08966248</td></tr> <tr><th scope="row" class="gt_row gt_right gt_stub">7</th> <td class="gt_row gt_left">Cucho</td> <td class="gt_row gt_left">Watford</td> <td class="gt_row gt_left">FW</td> <td class="gt_row gt_right">1147</td> <td class="gt_row gt_right">75</td> <td class="gt_row gt_right" style="background-color: rgba(185,149,206,0.8); color: #000000;">-0.04432508</td> <td class="gt_row gt_right">72.11470</td> <td class="gt_row gt_right" style="background-color: rgba(126,85,158,0.8); color: #FFFFFF;">-0.08795021</td></tr> <tr><th scope="row" class="gt_row gt_right gt_stub">8</th> <td class="gt_row gt_left">Mads Roerslev</td> <td class="gt_row gt_left">Brentford</td> <td class="gt_row gt_left">DF</td> <td class="gt_row gt_right">1240</td> <td class="gt_row gt_right">67</td> <td class="gt_row gt_right" style="background-color: rgba(233,223,240,0.8); color: #000000;">-0.14916419</td> <td class="gt_row gt_right">72.14783</td> <td class="gt_row gt_right" style="background-color: rgba(79,37,120,0.8); color: #FFFFFF;">-0.08398980</td></tr> <tr><th scope="row" class="gt_row gt_right gt_stub">9</th> <td class="gt_row gt_left">Marc Albrighton</td> <td class="gt_row gt_left">Leicester City</td> <td class="gt_row gt_left">FW</td> <td class="gt_row gt_right">1132</td> <td class="gt_row gt_right">76</td> <td class="gt_row gt_right" style="background-color: rgba(181,143,204,0.8); color: #000000;">-0.03443061</td> <td class="gt_row gt_right">72.65074</td> <td class="gt_row gt_right" style="background-color: rgba(59,15,104,0.8); color: #FFFFFF;">-0.08230763</td></tr> <tr><th scope="row" class="gt_row gt_right gt_stub">10</th> <td class="gt_row gt_left">Jóhann Berg Guðmundsson</td> <td class="gt_row gt_left">Burnley</td> <td class="gt_row gt_left">MF</td> <td class="gt_row gt_right">1102</td> <td class="gt_row gt_right">75</td> <td class="gt_row gt_right" style="background-color: rgba(187,152,208,0.8); color: #000000;">-0.04856484</td> <td class="gt_row gt_right">72.45273</td> <td class="gt_row gt_right" style="background-color: rgba(51,6,98,0.8); color: #FFFFFF;">-0.08168250</td></tr> </tbody> </table> </div> --- # Model Comparison ## Relation <img src="presentation_files/figure-html/output_relation-1.png" width="100%" /> --- # Model Comparison ## Distribution <img src="presentation_files/figure-html/output_comparison-1.png" width="100%" /> --- # Observation ## Position Value <img src="presentation_files/figure-html/output_position-1.png" width="100%" /> --- # Discussion ##Future Work - adding more data, increasing sample size to enhance model training and prediction accuracy - employing more supervised learning techniques to increase prior model quality - bagging to improve the stability and the accuracy of RAxGPM model - choice of response variable: could we find a better measurement for soccer? - implementing tracking data to build a more comprehensive model - constructing Bayesian framework to add uncertainty to the model through distribution ## Applications - predicting player’s market value and salary - optimal line-up recommendation - predicting game results and simulating league result - evaluating players across different leagues --- # References - Hvattum, L. (2019). A comprehensive review of plus-minus ratings for evaluating individual players in team sports. International Journal of Computer Science in Sport. - Matano, F., Richardson, L. F., Pospisil, T., Eubanks, C., & Qin, J. (2018). Augmenting adjusted plus-minus in soccer with FIFA ratings. arXiv preprint arXiv:1810.08032. - Rosenbaum, D. T. (2004, April 30). Picking the difference makers for the All-NBA Teams. 82games.com. Retrieved July 28, 2022, from https://www.82games.com/comm30.html - Sill, J. (2010). Improved NBA adjusted+/-using regularization and out-of-sample testing. In Proceedings of the 2010 MIT Sloan Sports Analytics Conference. - Zhang, B., Tran Hoac, E., Hoang P. (2022). A RAPM Model for Soccer Player Ratings. https://www.stat.cmu.edu/cmsac/sure/2022/showcase/soccer_rapm.html --- class: inverse center middle # Thanks! <br /> [@GaryBoyuanZhang](https://twitter.com/GaryBoyuanZhang)